| It was an up week for the major U.S. indices. Major US indices have a strongly overbought daily Williams' Percentage Range (W%R). Indices have a price below 50 & above 20 Day Moving Average. During the week, Dow Jones Industrial Average (^DJI) jumped 2666.84 points, or 12.67%, S&P 500 (^GSPC) rose 12.10%, and NASDAQ Composite Index (^IXIC) advanced 10.59% | |||
S&P 500 Trend Analysis: | |||
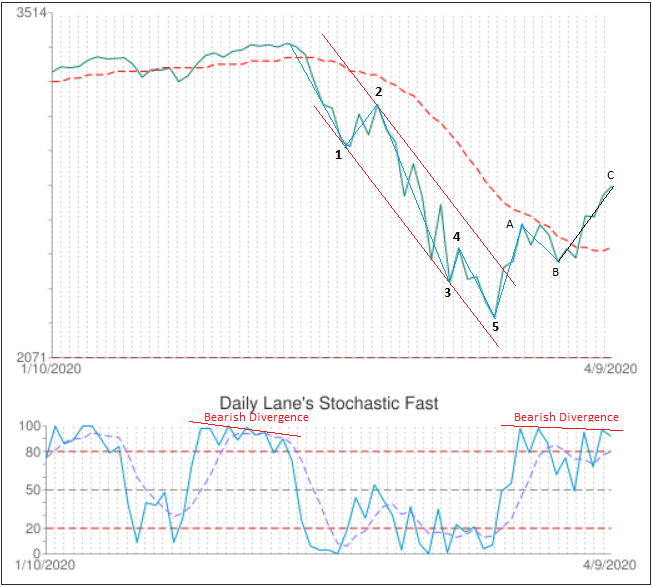
| In our previous S&P 500 Trend Analysis, published on March 20, 2020, we suggested: Considering how sharp was the weekly downtrend, the breaking channel support scenario has more chances. In this case, as you can see from the chart, the next support level is at 2346.58 that marks 30.85% decline from recent high. The fifth sub-wave of the Elliott Wave impulse pattern might not be over yet, but technical indicators show that it might be completed soon. According to Elliott Wave theory, the impulse wave is usually followed by three sub-waves correction structure in the opposite direction. The down wave was completed on Monday March 23 when S&P 500 index reached a new low 2191.86 (35.41% loss from February 19th high). The chart below shows the falling channel formed by a five-wave Elliott Wave impulse pattern. The third sub-wave actually presents the five-wave impulse pattern itself. This stricture often happens in steep and powerful trends. According to Elliott Wave theory, the complete wave's cycle consists of eight waves; the five- wave motive phase (waves 1, 2, 3, and 5) which is followed by three-wave corrective phase (waves A, B, and C). The 20 Day Moving Average is usually considered as a support/resistance level. The chart below shows that for seven days the corrective wave could not break this resistance level. When finally the 20 Day MA resistance was broken on Monday, April 6, the price raised 12.10% in one short week, making the biggest one week gain. | |||
| |||
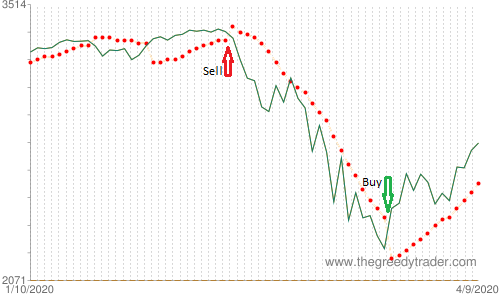
Wave A is almost equal to wave C, and the price is near the 50% Fibonacci retracement level (2792.69) which is usually considered as a support/resistance level. The daily Williams' Percentage Range (W%R) indicator is strongly overbought. The daily Lane's Stochastic is overbought and has bearish divergence (see the chart above). Almost 66% of S&P 500 component stocks have overbought daily Williams' Percentage Range (W%R). The bearish indicators and the resistance level suggest that the corrective phase might be over soon, but the C wave might be tricky. According to Elliott Wave theory the advancing C waves within upward corrections in larger bear markets are just as dynamic and can be mistaken for the start of a new upswing. If the C wave advances above 2792.69 50% Fibonacci retracement level, the 50 Day Moving Average will become the next resistance level (currently 2909.56). At this point, it would be a good idea to reduce the risk and use some stop losses techniques. In our previous newsletter, published on March 20, 2020, we suggested that in a trending market the trend following techniques work pretty well. The following chart shows how to use Parabolic SAR signals to reduce the risk and protect gains. The Parabolic SAR generates a buy signal when it moves below the price bars and sell signal when it moves above the price. On S&P 500 chart below the Parabolic SAR generated a sell signal on February 21st, 2020 when ^GSPC closed at 3337.75 below Parabolic SAR (3396.914). The buy signal was generated on March 24th when S&P 500 closed at 2447.33 above Parabolic SAR (2189.668). This trade made 26.67% gains in one month. | |||
| |||
Currently, Parabolic SAR value is 2580.98 that makes already 5.5% gains from the March 24th buy signal in 12 business days. Considering the high risk of the trend reversal, we recommend to use the Parabolic SAR technique to identify the exit points. S&P 500 Trend Analysis | |||