Saturday, April 18, 2020

Bear Market Correction Can Be Mistaken For The Start Of A New Upswing

It was a second consecutive positive week for the S&P 500 (^GSPC). During the week, the ^GSPC gained 84.74 points, or 3.04%, and closed at 2874.56 on Friday, April 17, 2020. ^GSPC was trading at an average weekly trading volume.

S&P 500 Trend Analysis:
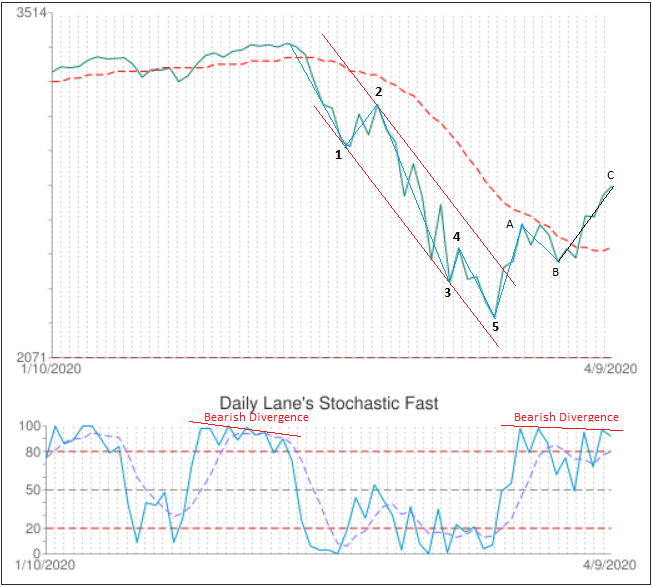
The S&P 500 weekly uptrend had started on March 23, 2020 at 2,191.86 and reached 2,879.22 on April 17, 2020, making a 31.36% gain in eighteen business days.

Weekly uptrend has formed a Rising Wedge chart pattern. The Rising Wedge in downtrend is considered as a continuation pattern, and it indicates that the monthly downtrend is not over yet. It is usually followed by the next downtrend sub-wave.


In our previous S&P 500 Trend Analysis, published on April 10, 2020, we suggested:

C wave might be tricky. According to Elliott Wave theory the advancing C wave within upward correction in larger bear markets are just as dynamic and can be mistaken for the start of a new upswing. If C wave advance above 2792.69 50% Fibonacci retracement level, the 50 Day Moving Average will be the next resistance level (currently 2909.56). At this point, it would be a good idea to reduce the risk and use some stop losses techniques... Considering the high risk of the trend reversal, we recommend to use the Parabolic SAR technique to identify the exit points.

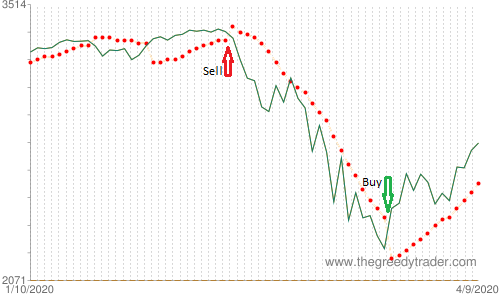
The latest Parabolic SAR buy signal was generated on March 24th when S&P 500 closed at 2447.33 above Parabolic SAR (2189.668). The current Parabolic SAR value is 2763.89 that is already 11.45% higher than the March 24th buy price.

^GSPC: S&P 500 Chart: S&P 500 Parabolic SAR signals

The ^GSPC price is now near the 50 Day Moving Average support level. The weekly volatility was 193% above average. The daily Lane's Stochastic and Williams' Percentage Range (W%R) are strongly overbought. Daily Moving Average Convergence Divergence (MACD) has bearish divergence.

^GSPC: S&P 500 Chart: S&P 500 Parabolic SAR signals

More than 34% of S&P 500 component stocks have the daily Williams' Percentage Range (W%R) strongly overbought. It is the highest level since January 18, 2019. Almost 16% of S&P 500 component stocks have daily MACD bearish divergence. It is the highest level since February 22, 2019 - the beginning of the downtrend wave. Taking into consideration the above trend analysis and bearish technical indicators, there is a high probability that the weekly uptrend might be over soon.

Sunday, April 12, 2020

Weekly Stock Market Overview (April 10, 2020)


It was an up week for the major U.S. indices. Major US indices have a strongly overbought daily Williams' Percentage Range (W%R). Indices have a price below 50 & above 20 Day Moving Average. During the week, Dow Jones Industrial Average (^DJI) jumped 2666.84 points, or 12.67%, S&P 500 (^GSPC) rose 12.10%, and NASDAQ Composite Index (^IXIC) advanced 10.59%

S&P 500 Trend Analysis:

In our previous S&P 500 Trend Analysis, published on March 20, 2020, we suggested:

Considering how sharp was the weekly downtrend, the breaking channel support scenario has more chances. In this case, as you can see from the chart, the next support level is at 2346.58 that marks 30.85% decline from recent high. The fifth sub-wave of the Elliott Wave impulse pattern might not be over yet, but technical indicators show that it might be completed soon. According to Elliott Wave theory, the impulse wave is usually followed by three sub-waves correction structure in the opposite direction. 

The down wave was completed on Monday March 23 when S&P 500 index reached a new low 2191.86 (35.41% loss from February 19th high). The chart below shows the falling channel formed by a five-wave Elliott Wave impulse pattern. The third sub-wave actually presents the five-wave impulse pattern itself. This stricture often happens in steep and powerful trends.

According to Elliott Wave theory, the complete wave's cycle consists of eight waves; the five- wave motive phase (waves 1, 2, 3, and 5) which is followed by three-wave corrective phase (waves A, B, and C).


The 20 Day Moving Average is usually considered as a support/resistance level. The chart below shows that for seven days the corrective wave could not break this resistance level. When finally the 20 Day MA resistance was broken on Monday, April 6, the price raised 12.10% in one short week, making the biggest one week gain.
^GSPC: S&P 500
Chart: S&P 500 Elliott Wave cycle consists of eight waves


Wave A is almost equal to wave C, and the price is near the 50% Fibonacci retracement level (2792.69) which is usually considered as a support/resistance level.

The daily Williams' Percentage Range (W%R) indicator is strongly overbought. The daily Lane's Stochastic is overbought and has bearish divergence (see the chart above). Almost 66% of S&P 500 component stocks have overbought daily Williams' Percentage Range (W%R).

The bearish indicators and the resistance level suggest that the corrective phase might be over soon, but the C wave might be tricky. According to Elliott Wave theory the advancing C waves within upward corrections in larger bear markets are just as dynamic and can be mistaken for the start of a new upswing. If the C wave advances above 2792.69 50% Fibonacci retracement level, the 50 Day Moving Average will become the next resistance level (currently 2909.56). At this point, it would be a good idea to reduce the risk and use some stop losses techniques.

In our previous newsletter, published on March 20, 2020, we suggested that in a trending market the trend following techniques work pretty well. The following chart shows how to use Parabolic SAR signals to reduce the risk and protect gains. The Parabolic SAR generates a buy signal when it moves below the price bars and sell signal when it moves above the price.

On S&P 500 chart below the Parabolic SAR generated a sell signal on February 21st, 2020 when ^GSPC closed at 3337.75 below Parabolic SAR (3396.914). The buy signal was generated on March 24th when S&P 500 closed at 2447.33 above Parabolic SAR (2189.668). This trade made 26.67% gains in one month.
^GSPC: S&P 500
Chart: S&P 500 Parabolic SAR signals

Currently, Parabolic SAR value is 2580.98 that makes already 5.5% gains from the March 24th buy signal in 12 business days. Considering the high risk of the trend reversal, we recommend to use the Parabolic SAR technique to identify the exit points.

S&P 500 Trend Analysis

Sunday, January 07, 2018

NASDAQ biggest weekly advance

Major U.S. indices moved higher over the past week. The monthly, weekly, and daily Relative Strength Index (RSI), Williams' Percentage Range (W%R), and Lane's Stochastic are strongly overbought. Weekly and daily technical indicators have bearish divergence. They are usually used to foreshadow yearly and quarterly uptrend reversals. More than 30% of S&P index members are trading at their highest price in the past 52 weeks. This is an important indicator in determining the current value of stocks. Almost 7.5% of S&P members have a weekly deliberation bearish candlestick pattern. The pattern occurs when there is a clear uptrend and is considered a bearish reversal signal.

During the past week, Dow Jones Industrial Average (^DJI) rose 576.65 points, or 2.33%, and closed at 25295.87. The S&P 500 (^GSPC) advanced 69.54 points, or 2.60%, and closed at 2743.15.

The NASDAQ Composite Index (^IXIC) advanced 233.17 points, or 3.38%, and closed at 7136.56. It was the biggest weekly advance recorded. The NASDAQ Composite Index weekly uptrend started on August 21, 2017 at 6,177.19 and reached 7,137.04 on January 05, 2018, making a 15.54% incline in nineteen weeks

www.thegreedytrader.com

Sunday, November 05, 2017

Eighth consecutive positive week for S&P 500

It was the eighth consecutive positive week for S&P 500 index (^GSPC). The price is above Upper Bollinger Band. The daily Williams' Percentage Rangeis overbought. The daily Williams' Percentage Range and Lane's Stochastic have a bearish divergence. The S&P 500 weekly uptrend started on August 21, 2017 at 2,417.35 and reached 2,588.42 on November 03, 2017, making 7.08% gain in eleven weeks.
^GSPC: S&P 500
More than 16% of S&P 500 component stocks have an above average weekly volume. It is the highest level since November 11, 2016. More than 40% of S&P 500 component stocks have an overbought weekly Lane's Stochastic. It is the highest level since April 29, 2016.

http://www.thegreedytrader.com/QQQQTrendAnalysis.aspx?r=248

Sunday, October 01, 2017

ETF's Currency Shares Alert

This week, the CurrencyShares Swedish Krona Trust (FXS) slid 3.04 points, or 2.53%.
The CurrencyShares Swedish Krona Trust weekly downtrend started on August 29, 2017 at 121.07 and reached 116.62 on September 27, 2017, making 3.68% decline in seventeen business days.


It was the biggest weekly drop since October 2015. The volume was 192% above average. This is a sign that there may be a significant move to come. FXS price is below 20 and 50 Day Moving Average. FXS price is near 50 Day Moving Average. Williams' Percentage Range and Lane's Stochastic are oversold in a daily time frame.

http://www.thegreedytrader.com/QQQQTrendAnalysis.aspx?r=247

Sunday, September 24, 2017

Dow Jones Industrial Average monthly uptrend - five-wave structure


Major US indices

It was a mixed week for the major U.S. indices. Daily Lane's Stochastic main line (K%) crossed below the overbought signal line (D%) for all three major US indices. The Stochastic crossover in the overbought area is a sell signal. Williams' Percentage Range and Lane's Stochastic are strongly overbought in a monthly time frame.

This week, the Dow Jones Industrial Average (^DJI) climbed 81.25 points and closed at 22349.59. The Dow Jones Industrial Average quarterly uptrend started on
January 20, 2016 at 15,450.56 and reached 22,419.51 on September 21, 2017, making 45.10% increase in twenty months.  

The Dow Jones Industrial Average monthly uptrend has formed a five-wave structure. It started on April 19, 2017 at 20,379.55 and reached 22,419.51 on September 21, 2017, making 10.01% advance in twenty two weeks.   

The fifth wave started on August 21, 2017 at 21,600.34 and reached 22,419.51 on September 21, 2017, making 3.79% gain in four weeks. 

The monthly Relative Strength Index (RSI) and The weekly Williams' Percentage Range (W%R) are strongly overbought. The weekly Relative Strength Index (RSI) and Lane's Stochastic (%D-Slow)  have bearish divergence. The bearish divergence can be used to predict tops. The daily Williams' Percentage Range (W%R) is overbought. 

Saturday, March 04, 2017

Sixth consecutive positive week for the S&P 500

Major U.S. indices moved higher over the past week. The monthly Williams' Percentage Range (W%R) is strongly overbought. The monthly Strongly Overbought Williams' Percentage Range (W%R) can be used to foreshadow yearly and quarterly uptrend reversals. The monthly Lane's Stochastic is strongly overbought. The weekly Lane's Stochastic main line (K%) crossed below the overbought signal line (D%). The Stochastic crossover in the overbought area is a bearish indicator. Indices have a strongly overbought weekly Lane's Stochastic. The price is above 20 & 50 Day Moving Average.

The S&P 500 (^GSPC) advanced 15.78 points and closed at 2383.12. It was the sixth consecutive positive week for the ^GSPC. Daily Lane's Stochastic main line (K%) crossed below the overbought signal line (D%). The Stochastic crossover in the overbought area is a bearish signal. Relative Strength Index is overbought in monthly and weekly time frames and has bearish divergence in a daily time frame. Williams' Percentage Range is strongly overbought in monthly and weekly time frames overbought in a daily time frame, and has bearish divergence in weekly and daily time frames. Lane's Stochastic is strongly overbought in monthly and weekly time frames and has bearish divergence in a daily time frame.

Sunday, October 18, 2015

Weekly Stock Market Overview Oct. 15, 2015

It was an up week for the major markets. For the week the Dow Jones Industrial Average gained 131.48 points or 0.77%. The Standard & Poor's 500 Index gained 18.22 points or 0.90%, while the Nasdaq Composite gained 56.22 points or 1.16%. Read More ...


The Utilities Select Sector SPDR sector was the strongest sector (2.26%) last week followed by the Health Care Select Sector SPDR sector (1.93%). The Industrial Select Sector SPDR sector was the worst performing sector (-1.55%) of the week followed by the Materials Select Sector SPDR sector (-0.14%).


The Technology sector is the most overvalued sector followed by Utilities, while Printed Circuit Boards, Semiconductor-Specialized, and Business Software & Svcs are among the most overvalued industries. The Consumer Goods sector is the most oversold sector followed by Financial, while Recreational Goods Other, Trucks & Other Vehicles, and Regional-Southeast Banks are among the most oversold industries.


Weekly S&P 500 Winners
Gains/Loses(%)SymbolCompanySector
12.20%SNDKSanDisk Corp.Information Technology
10.26%EAElectronic ArtsInformation Technology
8.20%TAPMolson Coors Brewing CompanyConsumer Staples


Weekly S&P 500 Losers
Gains/Loses(%)SymbolCompanySector
-29.31%PWRQuanta Services Inc.Industrials
-11.70%WMTWal-Mart StoresConsumer Staples
-11.27%NBRNabors Industries Ltd.Energy


Weekly S&P 500 Alerts
Stock Market AlertsCount
Downtrend Exhaustion1
Downtrend Broken Resistance75
Uptrend Support0
Uptrend Exhaustion7
Uptrend Broken Support0
Downtrend Resistance119
Oversold4

Saturday, September 05, 2015

S&P 500 - 12.54% decline in thirteen weeks

Weekly Stock Market Overview
All the major US indices were negative. For the week the Dow Jones Industrial Average dropped -540.63 points or -3.25%. The Standard & Poor's 500 Index dropped -67.65 points or -3.40%, while the Nasdaq Composite dropped -144.40 points or -2.99%. Major U.S. indices have price below 20 & 50 Day Moving Average.

The S&P 500 (^GSPC) lost 67.65 points to 1921.22. The S&P 500 quarterly downtrend started on May 20, 2015 at 2,134.72 and reached 1,867.01 on August 24, 2015, making 12.54% decline in thirteen weeks. Monthly Lane's Stochastic is overbought, and weekly volatility was 220% above average.
^GSPC: S&P 500

ETF's Indices Alert
This week the iShares MSCI Australia Index (EWA) fell 1.61 points to 17.54.
The iShares MSCI Australia Index weekly downtrend started on June 23, 2015 at 22.64 and reached 17.20 on August 24, 2015, making 24.03% drop in nine weeks.
EWA: iShares MSCI Australia Index
It was the biggest slide recorded. Volatility was 91% above average. Price falls below Parabolic SAR. It is a sell signal when the major trend is bearish. EWA price is below 20 and 50 Day Moving Average. Williams' Percentage Range is strongly oversold in a monthly and weekly time frames and oversold in a daily time frame. Lane's Stochastic is oversold in a monthly and weekly time frames.
EWA: iShares MSCI Australia Index

Sector Rotation
The Consumer Discretionary Select Sector SPDR sector was the strongest sector (-2.26%) last week followed by the Consumer Staples Select Sector SPDR sector (-2.35%). The Utilities Select Sector SPDR sector was the worst performing sector (-5.08%) of the week followed by the Health Care Select Sector SPDR sector (-4.35%).

The Basic Materials sector is the most overvalued sector followed by Utilities, while Diversified Utilities, Oil & Gas Equipment/Svcs, and Electric Utilities are among the most overvalued industries. The Services sector is the most oversold sector followed by Industrial Goods, while Publishing - Newspapers, Broadcasting - TV, and Gaming Activities are among the most oversold industries.

Weekly S&P 500 Winners
Gains/Loses(%) Symbol Company Sector
7.07% GCI Gannett Co. Consumer Discretionary
6.10% FTR Frontier Communications Telecommunications Services
5.94% VIAB Viacom Inc. Consumer Discretionary

Weekly S&P 500 Losers
Gains/Loses(%) Symbol Company Sector
-14.34% AVP Avon Products Consumer Staples
-11.83% ESV Ensco plc Energy
-11.32% NBR Nabors Industries Ltd. Energy

Weekly S&P 500 Alerts
Stock Market Alerts Count
Downtrend Exhaustion 5
Downtrend Broken Resistance 10
Uptrend Support 8
Uptrend Exhaustion 0
Uptrend Broken Support 0
Downtrend Resistance 4
Oversold 28

Sunday, August 30, 2015

ETF's Commodity Alert - United States Oil (USO) ended up 1.65 points, or 12.47%

Weekly Stock Market Overview
It was an up week for the major markets. For the week the Dow Jones Industrial Average gained 183.26 points or 1.11%. The Standard & Poor's 500 Index gained 17.98 points or 0.91%, while the Nasdaq Composite gained 122.28 points or 2.60%. Read More ...

The S&P 500 (^GSPC) rose 17.98 points to 1988.87.
The S&P 500 weekly downtrend started on July 20, 2015 at 2,132.82 and reached 1,867.01 on August 24, 2015, making 12.46% loss in five weeks.
^DJI: Dow Jones Industrial Average

Volume was 63% above average. Volatility was 210% above average. The chart has formed a daily bearish Advance Block candlestick pattern. This pattern occurs in an uptrend; it is not a top reversal pattern, but it might precede a meaningful price decline. The reliability of the Bearish Advance Block pattern is medium. Lane's Stochastic is overbought in a monthly time frame. Lane's Stochastic has bearish divergence in a monthly time frame.

S&P 500 Members Alerts
Almost 24% of S&P 500 component stocks have weekly lane's stochastic main line (k%) crossed above oversold signal line (d%). It is a highest level since June 08, 2012. More than 52% of S&P 500 component stocks have daily lane's stochastic main line (k%) crossed above oversold signal line (d%). It is a highest level since December 19, 2014.
The stochastic crossover in oversold area is considered a buy signal. The chart below shows how the weekly lane's stochastic main line (k%) crossed above oversold signal line (d%) on June 08, 2012 signals the S&P 500 downtrend reversal. The S&P 500 index monthly uptrend started on June 04, 2012 at 1,266.74 and reached 1,474.51 on September 14, 2012, making 16.40% gain in ten weeks.
^GSPC: S&P 500 Index

ETF's Commodity Alert
For the week the United States Oil (USO) ended up 1.65 points, or 12.47%, to 14.88. The United States Oil weekly downtrend started on June 02, 2015 at 20.80 and reached 12.37 on August 24, 2015, making 40.53% loss in twelve weeks.
USO: United States Oil
It was the biggest advance recorded. Volume was 269% above average. USO has a selling climax signal. Price rises above Parabolic SAR. USO price is below 50 and above 20 Day Moving Average. Williams' Percentage Range is strongly oversold in a monthly time frame and oversold in a weekly time frame. Lane's Stochastic is strongly oversold in a weekly time frame and oversold in a monthly time frame.
USO: United States Oil

Sector Rotation
The Energy Select Sector SPDR sector was the strongest sector (3.54%) last week followed by the Technology Select Sector SPDR sector (2.63%). The Utilities Select Sector SPDR sector was the worst performing sector (-4.22%) of the week followed by the Consumer Staples Select Sector SPDR sector (-0.15%).


The Industrial Goods sector is the most overvalued sector followed by Utilities, while Waste Management, Residential Construction, and Aerospace/Defense-Maj Dvd are among the most overvalued industries. The Services sector is the most oversold sector followed by Conglomerates, while Publishing - Newspapers, Broadcasting - TV, and Department Stores are among the most oversold industries.


Weekly S&P 500 Winners
Gains/Loses(%) Symbol Company Sector
47.76% CAM Cameron International Energy
34.27% BTU Peabody Energy Corp Materials
26.54% GAS NICOR Inc. Utilities


Weekly S&P 500 Losers
Gains/Loses(%) Symbol Company Sector
-14.87% POM Pepco Holdings Inc. Utilities
-8.19% ADSK Autodesk, Inc. Information Technology
-7.06% CTXS Citrix Systems Information Technology


Weekly S&P 500 Alerts
Stock Market Alerts Count
Downtrend Exhaustion 2
Downtrend Broken Resistance 11
Uptrend Support 5
Uptrend Exhaustion 0
Uptrend Broken Support 1
Downtrend Resistance 2
Oversold 15